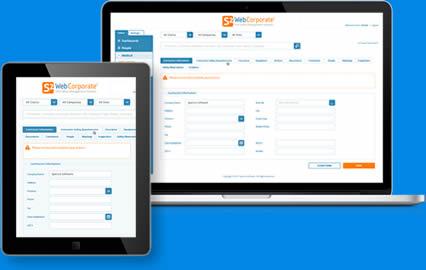
Safety reports and charts are essential for making good business decisions which is why you'll find them available throughout S2Web safety software. Choose from multiple statistical or graphic chart types. Create unique segments for revealing hidden safety issues and highlighting Key Performance Indicators (KPI's). Easily distribute to colleagues in a variety of electronic or hardcopy formats or save to your dashboard for future reference.
See below for more information on S2Web's Safety Reporting features
Reports and Charts are pervasive in S2Web safety software and feature in almost every module. Two report types are available: summary reports that display a broad selection of records, and Individual reports that show more details from a single record. All are completely configurable and can be easily shared or saved for future reference.
S2Web's Reporting features include powerful search parameters and filtering capabilities. These allow you to drill-down into data and create unique segments for revealing hidden safety problems and highlight the Key Performance Indicator figures for informing your business decisions.
New to S2Web—Dashboards is a space where you can save custom reports for actively monitoring the performance of your organization. For use by management and safety officers, saved Dashboard reports can be displayed as statistics or graphic charts with custom colour keys allowing you to see all your KPI's and activity gaps at a glance.
Reports can be exported to a number of different file types to enable data interchange between systems. Formats include XML, Excel, Word or CSV. S2Web also has a number of options for importing data from external systems, including CSV files or JSON end points.
Got a Question? Talk to a safety professional or sign-up for a FREE Demonstration.
Sign-up for a guided tour of S2Web and learn how to improve workplace safety to significantly lower your costs and increase productivity.
Request a Demo